flowchart TD
Q{"What are you doing?"} --> T["Quick test: does it run?"]
Q --> D["Interactive development"]
Q --> N["Normal CPU job, under 3 days"]
Q --> Lng["Long simulation, 3-7 days"]
Q --> G["GPU work"]
T --> Tp["partition debug + qos debug"]
D --> Dp["partition mb + qos interactive"]
N --> Np["partition mb or mb,teton + qos normal/fast"]
Lng --> Lp["partition non-investor + qos long + checkpoint"]
G --> Gq{"iterating or production?"}
Gq -->|"dev"| Gd["partition mb-a30"]
Gq -->|"production"| Gp["partition mb-h100 / mb-l40s"]
6 Partitions, QOS, and queue times
Where to send a job and how long you’ll wait — the highest-leverage choices you make.
6.1 Partitions and QOS on MedicineBow
6.1.1 Partition = which hardware
A partition is a named pool of nodes. Submit with --partition=<name> (the default is mb). The mb prefix stands for MedicineBow — mb is the general-purpose CPU pool, and the mb-* partitions are the GPU pools, each named for the NVIDIA GPU it holds. (teton, beartooth, and wildiris are older clusters absorbed into MedicineBow, which is why they lack the prefix.)
| Partition | Nodes | Cores/node | Mem/node | GPUs/node | Good for |
|---|---|---|---|---|---|
mb (default) |
25 | 96 (EPYC 9454) | ~1023 GB | — | general CPU work |
mb-h100 |
6 | 96 | ~1281 GB | 8× H100 | large model training, PINNs |
mb-l40s |
4 | 96 | ~765 GB | 8× L40S¹ | inference, mid-size training |
mb-a30 |
8 | 96 | ~765 GB | 8× A30 | dev/GPU, smaller models |
mb-a6000 |
1 | 64 | ~1023 GB | 4× A6000 | GPU dev |
mb-r6000 |
3 | 72 | ~515 GB | 4× R6000 | GPU dev |
debug |
4 | 28 | ~128 GB | — | quick tests (pair with debug QOS) |
teton |
~250 | 32 | ~120 GB+ | — | large CPU throughput, arrays |
beartooth |
9 | 56 | ~257 GB+ | — | CPU work |
wildiris |
5 | 48 | ~507 GB+ | — | CPU work |
non-investor |
110 | mixed | mixed | — | CPU work you don’t want preempted |
non-investor-gpu |
7 | mixed | mixed | mixed | GPU work you don’t want preempted |
inv-* |
varies | varies | varies | varies | investor-owned; borrowable but preemptible |
¹ One L40S node has 4 GPUs instead of 8. Numbers are the machine as observed in July 2026; verify current state with showpartitions and sinfo.
The inv-* partitions are investor (“condo”) hardware: you can run on them when they’re idle, but the owner can reclaim the node and preempt your job (Section 8.1).
Avoiding preemption: use
non-investor, not --constraint
--constraint=non-investor matches nothing on the current machine and does nothing. Use a partition instead: --partition=non-investor (110 nodes) or --partition=non-investor-gpu (7 GPU nodes; you must also request a GPU with --gres=gpu:N there) stays on hardware that won’t be reclaimed. This is the right home for long, un-checkpointed runs.
You can list several partitions and let Slurm use whichever frees up first; --partition=mb,teton,beartooth is common for CPU throughput work.
6.1.2 QOS = which service tier
A Quality of Service sets three things at once: your maximum walltime, your CPU footprint cap, and your priority. Submit with --qos=<name> (the default is normal).
| QOS | Priority | Max walltime | CPU cap / account | Your project can use it? |
|---|---|---|---|---|
interactive |
90 | 8 h | 4746 | ✅ |
fast |
80 | 12 h | 4746 | ✅ |
normal (default) |
70 | 3 d | 4746 | ✅ |
long |
60 | 7 d | 2876 | ✅ |
debug |
0 | 1 h | 7 cpu / 32 G / 2 nodes | ✅ |
extended |
50 | 14 d | 2157 | ❌ (not granted) |
inv-* (investor) |
110 | 14 d | varies | ❌ (owners only) |
Confirm your own list any time:
sacctmgr -n show assoc user=$USER format=qos
# <project>:  debug, fast, interactive, long, normal
sqos                         # full QOS table with limits
The walltime trade-off
Longer requested walltime means lower priority and a smaller footprint cap. fast (12 h) gives priority 80 and the full 4746-core cap; long (7 d) drops to priority 60 and a ~40%-smaller cap. This trade-off drives the recommendations in Section 6.2.
6.1.3 DenyOnLimit: rejected at submit
Every user-facing QOS is flagged DenyOnLimit. If you ask for more than a QOS allows — say a 5-day run under normal (max 3 d), or more cores than the cap — Slurm rejects the job at submit time with a clear error rather than queuing it indefinitely. Fix the request and resubmit.
6.1.4 Putting both knobs in a script
#SBATCH --partition=mb          # hardware: general CPU nodes
#SBATCH --qos=fast              # tier: 12h max, high priority
#SBATCH --time=02:00:00         # within the fast 12h ceiling
For a GPU job:
#SBATCH --partition=mb-l40s
#SBATCH --qos=normal
#SBATCH --gres=gpu:1            # ask for 1 GPU (see @sec-gpu)
#SBATCH --time=08:00:00
6.2 Queue times: which partition for what
6.2.1 What the queue looks like
At a representative midday moment on MedicineBow there were roughly 2,000 jobs running and 800 pending. Almost every pending job’s reason was Priority — the machine is busy and you’re in line, not that you asked for something impossible.
6.2.2 Measured wait times (start minus eligible)
The table below is from ~1.7 million jobs over a recent 3-day window, measured as the time between a job becoming eligible and starting. Read it for order of magnitude, not as a promise; your wait depends on how busy the machine is and how big your request is.
| Partition | Median wait | 90th percentile | Character |
|---|---|---|---|
teton |
~0 s | ~13 min | huge pool; throughput/array work starts fast |
mb (default CPU) |
<1 min | ~10 min | plentiful; short CPU jobs start quickly |
beartooth |
~4 min | ~11 min | steady CPU capacity |
mb-a30 (GPU) |
~2 min | ~1.5 h | smaller GPUs, usually gettable |
mb-h100 (GPU) |
seconds–hours | ~8–9 h | bimodal: idle now, or a long wait |
mb-l40s (GPU) |
~1 h | ~2–6 h | consistently contended |
beartooth-gpu |
~1 h | ~7 h | contended |
By QOS, the CPU signal is even clearer:
| QOS | Median wait | 90th percentile |
|---|---|---|
interactive |
~11 s | ~30 s |
fast |
~0 s | ~13 min |
normal |
~19 s | ~8 min |
How to read these numbers
This window included a large fast-QOS job array on teton, which pulls the teton/fast medians toward zero. The normal-QOS row (tens of thousands of ordinary jobs: median ~19 s, 90th percentile ~8 min) is the most representative figure for a normal CPU job. The pattern holds either way: CPU work starts fast; GPU work, especially L40S/H100, is where you wait. Measure the live picture before a big campaign — see the commands at the end of this chapter.
6.2.2.1 The longer view: wait times month by month
The tables above are a short snapshot. The figure below is the full history — every finished job from June 2024 to July 2026, about 70 million of them — as a box plot of wait time per month, with the monthly job count underneath.
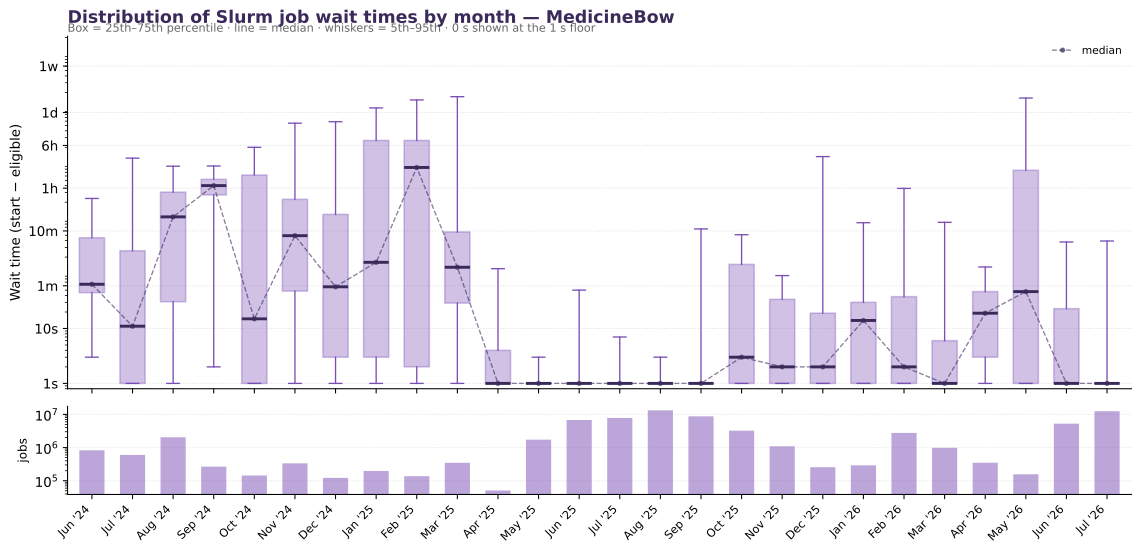
Two things stand out. Wait times vary a lot month to month: median waits range from about a second in quiet, array-dominated months to tens of minutes when the machine is busy, and the busiest months push the 90th percentile into hours. And the very low medians in the high-volume recent months are the signature of large fast-QOS job arrays (Section 7.2) that start almost instantly — one well-behaved sweep can move the whole month’s median. The planning takeaway is unchanged: a normal CPU job usually starts within minutes, but how busy the machine is this month matters, so check the live queue before a big campaign (end of chapter).
6.2.2.2 The same picture, split by partition
The heatmap below is those same 26 months broken out by partition — median wait on top, 90th percentile below. It’s the visual form of the partition table: the CPU pools (mb, teton, beartooth, non-investor) stay cool most months, while the GPU partitions — especially mb-l40s and mb-h100 — run hot, sometimes for months at a stretch.
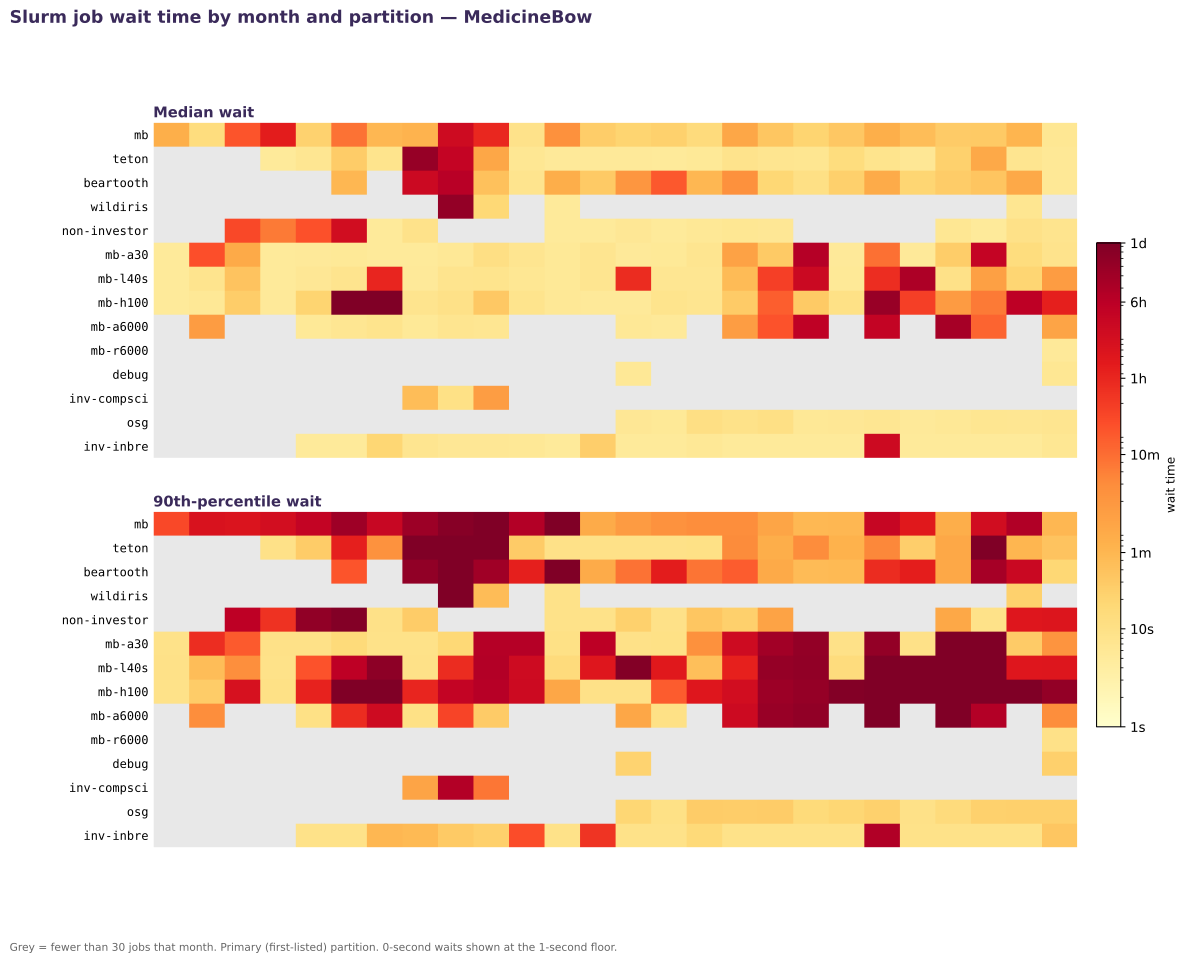
(When you submit — hour of day or day of week — barely moves the needle by comparison: across these 26 months the median wait is flat around a few seconds whenever you submit. Spend your effort on the partition and QOS, not on timing.)
6.3 Short proof-of-concept vs. long simulation
6.3.0.1 Short proof-of-concept / debugging / “does it even run?”
You want to start now, run briefly, and iterate. Priority and low wait matter; walltime and footprint don’t.
#SBATCH --partition=debug        # 4 dedicated test nodes, usually idle
#SBATCH --qos=debug              # 1 h max, but starts almost instantly
#SBATCH --time=00:30:00
#SBATCH --cpus-per-task=2
#SBATCH --mem=8G- Use the
debugpartition +debugQOS for the fastest possible start on a tiny job (cap: 1 h, ≤2 nodes, ≤7 cores, ≤32 G). - Need a bit more than debug allows but still want to start fast? Use
fastQOS onmb(12 h ceiling, priority 80) — median start of seconds. - Developing interactively?
interactiveQOS starts in ~10–30 s (Section 7.3). - For GPU proof-of-concept, develop on
mb-a30(starts in minutes), not H100.
6.3.0.2 Long production simulation / big ensemble / final runs
You need days of walltime and want to avoid preemption, accepting a longer initial wait in exchange for a long, stable run.
#SBATCH --partition=non-investor   # big pool that won't be reclaimed
#SBATCH --qos=long                 # up to 7 days
#SBATCH --time=5-00:00:00
#SBATCH --cpus-per-task=16
#SBATCH --mem=32G- Use
longQOS for multi-day runs (7 d ceiling).normal(3 d) is the default and fine for sub-3-day jobs. - Submit to
--partition=non-investor(CPU) ornon-investor-gpu(GPU) so an investor can’t reclaim your node mid-run. Or list several CPU partitions (--partition=mb,teton,beartooth) to start on whichever frees first — at the cost of possible preemption oninv-*hardware. - Checkpoint (Section 8.1.3) so a node failure, walltime overrun, or preemption doesn’t cost you the whole run.
- Right-size first (Section 5.3): a leaner request under
longstarts sooner than a bloated one.
6.3.0.3 The quick decision table
| Your situation | Partition | QOS | Why |
|---|---|---|---|
| “Does my script run at all?” | debug |
debug |
near-instant start, 1 h cap |
| Fast CPU test, up to 12 h | mb |
fast |
priority 80, full core cap, seconds to start |
| Interactive development | mb |
interactive |
~10–30 s start, live shell |
| Normal CPU job, < 3 days | mb (or mb,teton) |
normal |
default; ~20 s median start |
| Long CPU simulation, 3–7 days | non-investor |
long |
big non-preemptible pool |
| GPU proof-of-concept | mb-a30 |
normal |
GPUs you can usually get in minutes |
| GPU production / big training | mb-h100 / mb-l40s |
normal/long |
most power; expect an hours-long wait |
6.3.1 Check the live queue before you commit
Historical medians are a guide; the live machine is what matters. Before a big submission:
showpartitions               # idle vs busy nodes, per partition, right now
sinfo -p mb-h100 -o "%P %t %D"   # how many H100 nodes are idle this second?
gpuavail                     # ARCC helper: free GPUs by type
squeue -p mb-l40s            # how deep is the line for this partition?
showuserlimits               # what am I allowed to ask for?
If showpartitions shows idle H100 nodes, submit now. If the GPU partitions are full and the line is long, either develop on mb-a30 or submit and walk away.
Once a job is queued, showjobreasons <jobid> explains why it’s still pending (Section 7.1) — usually Priority (wait) or Resources (large request).
Section 6.4 explains why QOS dominates your position in that line.
6.4 How priority is computed
6.4.1 The formula
Slurm computes a priority score for every pending job and runs the highest scores first (subject to backfill, below). The score is a weighted sum; MedicineBow’s weights are:
PriorityWeightQOS       = 200     <- dominant
PriorityWeightFairShare = 100
PriorityWeightJobSize   = 100
PriorityWeightAge       = 10
PriorityWeightPartition = 0       (partition doesn't affect priority here)
Each factor is a number between 0 and 1, multiplied by its weight, and summed. The biggest lever, by a wide margin, is QOS.
6.4.2 What each factor means
QOS (weight 200). Higher-priority QOS means a better position. From Section 6.1: interactive (90) > fast (80) > normal (70) > long (60). Choosing fast over long is worth more priority than any amount of waiting, which is why the short-vs-long decision in Section 6.2 matters.
Fair-share (weight 100) — recent usage. Slurm tracks how much your account has used lately relative to its share. Heavy use this week lowers your fair-share factor, and thus your priority, for a while; it recovers as usage decays (half-life ~7 days here). This mechanism stops any one group from monopolizing the machine and rewards steady use over bursts.
Job size (weight 100). A factor based on the resources requested. With the SMALL_RELATIVE_TO_TIME flag this cluster sets, it interacts with your time request — another reason not to over-ask (Section 5.3).
Age (weight 10) — time spent waiting. A job gains priority the longer it sits, maxing out after ~3 days. At weight 10, age is a tie-breaker, not a strategy; you won’t age past someone who chose a better QOS.
6.4.3 Practical takeaway
QOS dominates priority
Because QOS is weighted 2× fair-share and 20× age, the highest-leverage choice for start time is the most appropriate high-priority QOS your job fits — the shortest walltime tier that still lets it finish (Section 6.2). Waiting longer, resubmitting, or submitting at 3am have little effect by comparison.
6.4.4 Backfill: why a small job can jump the line
Priority sets the order, but Slurm also backfills: if the top job is waiting for, say, 40 nodes to free up, Slurm slots a smaller, shorter job into the gap now, as long as that doesn’t delay the top job’s reserved start time. This is why a 20-minute test can start immediately even when the queue looks deep, and why short jobs start sooner than long ones. Requesting less time and fewer resources makes your job backfill-eligible in more gaps — another payoff for right-sizing.
6.4.5 Seeing your own priority
sprio -j <jobid>            # the priority breakdown for a pending job
sprio -l                    # all pending jobs, with factor columns
showjobreasons <jobid>      # ARCC helper: plain-language "why am I waiting?"
If sprio shows a low QOS factor because you’re on long but the job would finish in 10 hours, resubmitting under fast is the most effective change you can make.
Next: watching jobs run and diagnosing them when they don’t (Section 7.1).